The Nifty PE ratio, commonly referred to as the Price-to-Earnings (P/E) ratio, is an essential financial metric that computes the average P/E ratio of the 50 companies included in the Nifty 50 Index. The terms “Nifty PE” and “Nifty 50 PE” can be used interchangeably and serve to evaluate the current valuation of these companies to their total earnings. Essentially, the Nifty PE ratio assists investors in determining whether the markets are overvalued or undervalued. Before exploring its significance, it is important to understand what a P/E ratio represents.
Table of Contents
What is the Price-to-Earnings (PE) Ratio?
The Price-to-Earnings (P/E) Ratio is a financial metric that quantifies the relationship between a company’s share price and its earnings per share (EPS). It is calculated using the formula: (PE Ratio = Share Price / Earnings per Share). This ratio provides insight into how much investors are willing to pay for each unit of profit generated by the company. For example, if a company has a PE ratio of 36, this means that investors are willing to pay INR 36 for every INR 1 of profit the company earns.
The Nifty PE Ratio is a crucial financial metric that indicates the price investors are willing to pay for every rupee of profit generated by the 50 companies listed in the Nifty 50 Index. It is derived by dividing the market capitalization of the index by the total earnings of its constituent companies over the trailing four quarters.
Read Also: Nifty 50 Stock List in 2025: Important Stocks
What is the Nifty 50 PE ratio?
The Nifty 50 PE Ratio is an essential metric that reflects the average Price-to-Earnings ratio of the 50 companies listed in the Nifty 50 Index. This ratio serves as a key indicator of the overall valuation of the index and provides insights into the health of the stock market.
Current Nifty PE Ratio
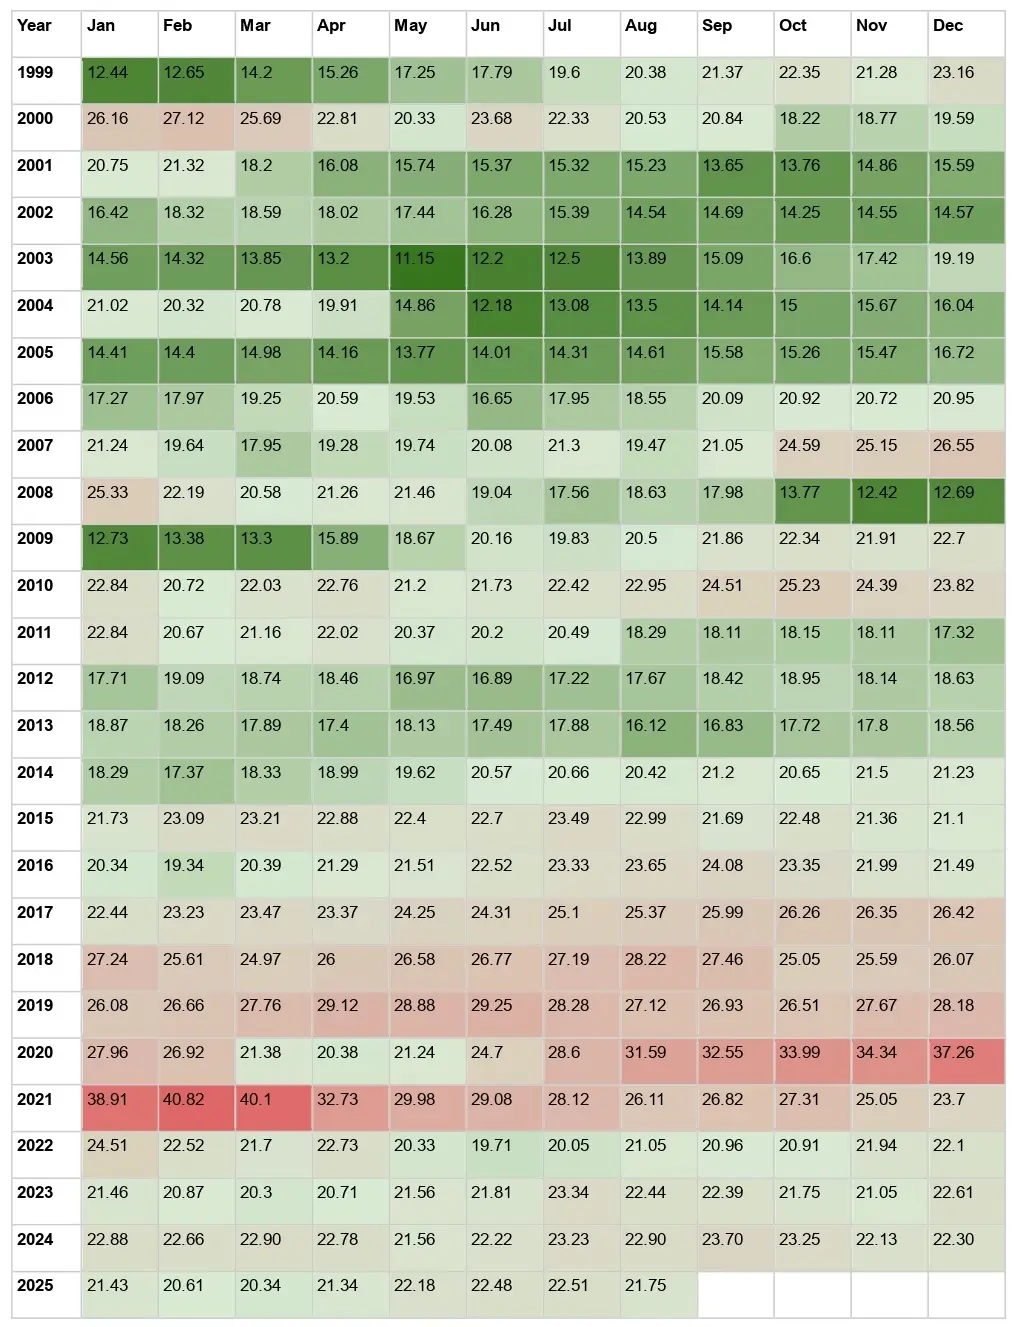
The current Nifty PE ratio today, as of 29 August 2025, is 21.46. This suggests that investors are willing to pay INR 19.67 for every INR 1 of earnings generated by the companies within this index.
Interpretation of Nifty PE Ratio
- Overvalued Market: A Nifty PE ratio at or above 22 is generally considered overvalued, indicating that the market may be relatively expensive. This could signal caution for potential investors.
- Undervalued Market: Conversely, a ratio below 12 is seen as undervalued, suggesting that the market might be relatively cheaper and potentially a good investment opportunity.
Historical Context
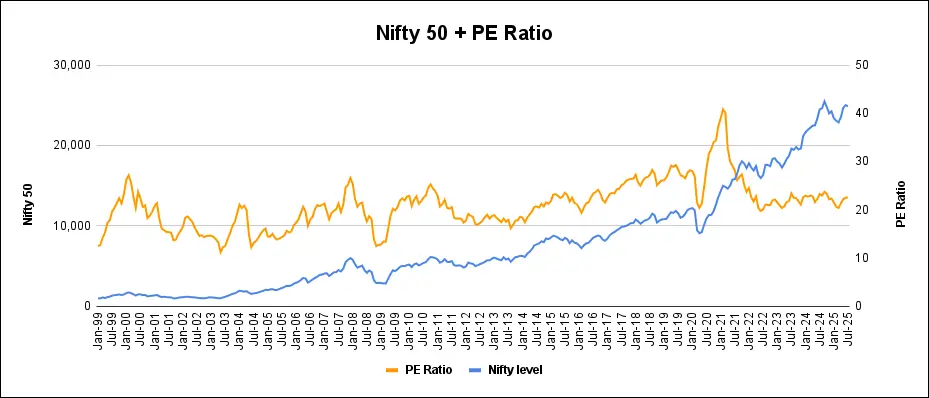
The average P/E ratio for the Nifty 50 typically falls within the range of 20 to 25. Historical data show that lower P/E ratios (around 15 – 16) have historically provided better returns for investors compared to periods with higher ratios. Notably, when the Nifty P/E surpassed 22, subsequent returns tended to be negative over the following three years.
The Nifty 50 has experienced significant fluctuations in its P/E ratio, with an all-time high of 40.43 recorded on 20 February 2021. Such extremes highlight the volatility and varying investor sentiment in the market.
The tables below demonstrate the absolute return on investment in Nifty 50 companies for different PE ratios, providing valuable insights for investors in their decision-making process.
| Nifty 50 PE Ratio | Less than 12 |
| Less than 12 | 38.7% |
| Between 12 & 15 | 30.7% |
| Between 15 & 18 | 17.1% |
| Between 18 & 21 | 9.3% |
| Between 21 & 24 | 4.4% |
| Between 24 & 27 | -4.2% |
| Above 27 | -7.9% |
Read Also: Nifty Auto Stocks List With Weightage in 2025
Nifty PE Ratio vs Nifty Index Value

When making investment decisions, it’s crucial to understand that relying solely on the Nifty index value can be misleading. A higher index value does not inherently indicate a better investment opportunity. For example, an index value of 17,500 with a P/E ratio of 20 is more attractive than an index value of 15,000 with a P/E ratio of 30. This highlights the importance of considering the P/E ratio alongside the index value.
Mean Reversion and P/E Ratio
The concept of mean reversion is significant in the context of indices like the Nifty 50 and is closely linked to the P/E ratio. Historical data indicates that:
- The Nifty index tends to increase when the Nifty 50 P/E ratio falls into what is considered an “attractive zone.”
- Conversely, when the Nifty P/E ratio surpasses 25, the index has often corrected itself, indicating potential overvaluation.
However, these patterns typically unfold over extended periods—often months or years—so there may be exceptions. For instance, in 2020, investors still saw profits even when the index P/E ratio exceeded 25, and it reached a high of 40 in 2021 before earnings improvements led to a decline in the P/E ratio to more reasonable levels.
One important consideration is that the average Nifty 50 PE ratio has been increasing over the years. As a result, historical figures may not serve as reliable benchmarks for making investment decisions.
Nifty PE Ratio Valuation Indicator
The table below provides a summary of the value investing rationale for the Nifty PE, offering valuable insights to investors seeking to navigate the stock market wisely.
| Nifty PE Ratio Range | Valuation | Market Sentiment | Decision |
| 27-35 | Very Expensive | Too much greedy | Don’t buy |
| 22-27 | Expensive | Greedy | Exit Booking profit |
| 15-22 | Average | Normal | Hold |
| 11-15 | Inexpensive | Fear | Buy |
| < 11 | Extremely Inexpensive | Very much fear | A rare event, Buy more |
Read Also: Best Platforms For Virtual Trading in India
Key Points About Nifty PE Ratio Chart

#1 Standalone vs. Consolidated
Over the past decade, many Indian companies have pursued substantial overseas acquisitions, greatly enhancing their operations and profitability. All companies listed in the Nifty 50 have participated in mergers and acquisitions. However, it is important to note that the Nifty’s published price-earnings ratio is calculated based on standalone earnings rather than consolidated earnings. As companies increasingly expand through acquisitions, the relevance of considering consolidated earnings grows, as these can vary significantly from standalone figures.
#2 Uneven Sector Distribution of Nifty PE Ratio
The Nifty 50 Index encompasses a range of sectors, including FMCG, IT, Oil, Construction, Metals, Retail, and Banks. Among these, the FMCG, IT, and Banking sectors significantly influence the movement of the price index. When these dominant sectors face a downturn, even cyclical sectors such as construction, metals, and gas may exert less influence on the Nifty PE ratio. This can result in understated values despite their high earnings per share (EPS). Therefore, it is essential for investors to closely monitor the Nifty 50 in such situations to make well-informed decisions.
Conclusion
- A Nifty 50 PE ratio of 18 indicates that investors are willing to pay 18 times the earnings of the 50 constituent companies in the index. When the Nifty PE ratio drops below 12, it suggests that the index is in the oversold zone, while a rise above 24 indicates an overbought condition.
- Investors can expect the market to rebound from oversold levels, although this recovery can take varying lengths of time, ranging from months to years. Conversely, the market does not rise continuously; it experiences corrections when overbought.
- Savvy investors take advantage of the cycles of greed and fear, looking for opportunities when Nifty PE levels fall into a favorable range.
- Over time, the average PE ratio of the Nifty 50 has shown an upward trend.
Before making investments, it is crucial to conduct a fundamental analysis and consider a combination of various valuation models.
Happy Investing!
Read Also: Nifty50 vs Nifty Next 50: Which Index is Better?
Nifty 50 FAQ
What is the current Nifty PE ratio?
The current Nifty PE ratio as of 29 August 2025 is 21.46.
When is the Nifty 50 considered undervalued and overvalued in PE terms?
The nifty 50 index is generally considered undervalued below the PE ratio of 12 and overvalued above the corresponding figure of 24.
Is Nifty 50 expensive at current levels?
Historical data suggests that the Nifty 50 is fairly valued at the current August 2025 average PE ratio of 21.75.
What is the highest PE ratio recorded for the Nifty 50?
In the last 20 years, the Nifty PE ratio reached an all-time high of 40.43 on 20 February 2021.


Very valuable and explained in more simplified manner. Thanks