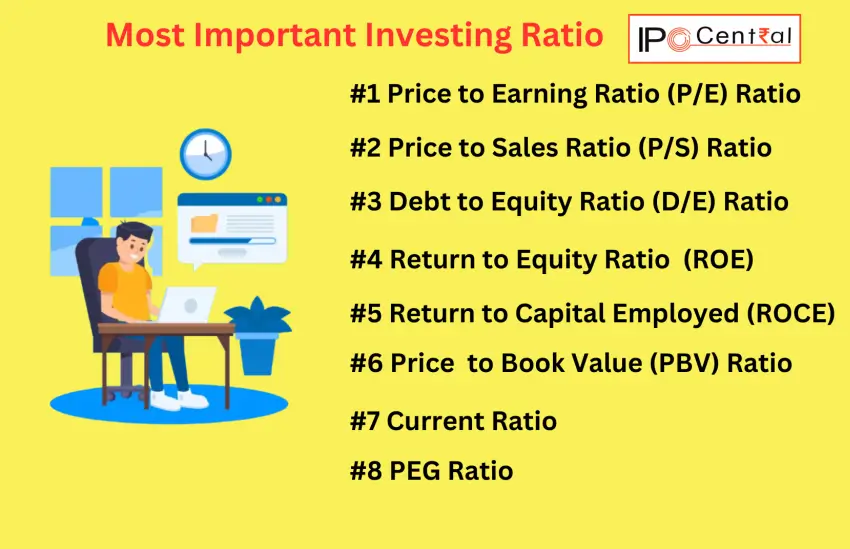
An Initial Public Offering (IPO), marking the first public sale of a company’s shares, is a highly anticipated event for both investors and company insiders. However, selecting the right IPOs can be challenging, as it requires a thorough analysis of the company’s financials to evaluate its true worth. To simplify this process, IPO Central has curated a list of the eight most essential financial ratios for IPO investing.

Table of Contents

#1 Price-to-Earnings (P/E) Ratio – Among Most Popular Ratios in IPO Investing
The P/E ratio is a measure of a company’s stock price relative to its earnings per share (EPS). It is calculated by dividing the current stock price by the EPS. A high P/E ratio indicates that the stock is overvalued, while a low P/E ratio indicates that the stock is undervalued.
P/E Ratio = Price / EPS (Earning Per Share)
For example, if a company has a P/E ratio of 20, it means that investors are willing to pay INR 20 for every INR 1 of earnings. On the other hand, if a company has a P/E ratio of 10, it means that investors are willing to pay only INR 10 for every INR 1 of earnings.
P/E ratio is very easy to understand and intuitively makes sense. It is for this reason that it is among the most used ratios in IPO investing. However, it is not uniform across industries and a figure of 20 may be too high for some industries and too low for others. Generally speaking, companies from mature industries with low growth rates tend to have lower P/E ratios than their counterparts from high-growth sectors. In addition, several other factors such as corporate governance are also at play in deciding valuation.
Read Also: Nifty PE Ratio – Most Important Points You Need to Know
#2 Price-to-Sales (P/S) Ratio
The P/S ratio is a measure of a company’s stock price relative to its revenue per share. It is calculated by dividing the current stock price by the revenue per share. A high P/S ratio indicates that the stock is overvalued, while a low P/S ratio indicates that the stock is undervalued.
For example, if a company has a P/S ratio of 3, it means that investors are willing to pay INR 3 for every INR 1 of revenue. On the other hand, if a company has a P/S ratio of 0.5, it means that investors are willing to pay only INR 0.5 for every INR 1 of revenue.
Similar to P/E ratio, P/S ratio is also subject to vary a lot across industries. Value investors tend to place a lot of emphasis on this metric as it offers a bird’s eye view regarding the valuations of companies in an industry.
Read Also: TReDS Portal: Meaning, Full Form, and All 8 important points you need to Know
#3 Debt-to-Equity (D/E) Ratio – IPO Investing Made Easy
The D/E ratio is a measure of a company’s debt relative to its equity. It is calculated by dividing the company’s total debt by its total equity. A high D/E ratio indicates that the company has a high level of debt, which can be risky for investors as the company has to pay interest on the debt which eventually reduces profits for shareholders.
As an example, a company with a D/E ratio of 2 simply has twice as much debt as equity. On the other hand, if a company has a D/E ratio of 0.5, it means that the company has half as much debt as equity.
While low debt is always preferred, it may be indispensable in capital-intensive industries such as capital goods and EPC. In a similar vein, high-debt companies tend to post higher profits than their debt-free counterparts in low-interest regimes but fare worse otherwise. Simply put, as long as a company is able to generate higher returns than its cost of debt, debt isn’t bad for its balance sheet.
Read Also: How to find good IPOs?
#4 Return on Equity (ROE)
The ROE is a measure of a company’s profitability relative to its equity. It is calculated by dividing the company’s net income (net profit) by its total equity. A high ROE indicates that the company is generating a high level of profits relative to its equity.
Unlike the earlier ratios, this metric is calculated as a percentage figure and works well across industries. As a rule of thumb, any business that consistently generates ROE above 15% is considered investment worthy.
Read Also: IEPF Form 5: Important points about claiming unclaimed dividend and shares
#5 Return on Capital Employed (ROCE)
Like ROE, ROCE is also used to assess a company’s profitability and capital efficiency. However, it differs from ROE in the sense that it also takes into account debt capital. It is calculated by dividing the company’s Earnings Before Interest and Tax (EBIT) by Capital Employed which is defined as the difference between Total Assets and Current Liabilities.
As mentioned earlier, debt isn’t necessarily a bad component on the balance sheet and thus, ROCE is a comprehensive indicator regarding the effective use of capital. A higher figure is better and it can also be denominated in percentage. Since it provides a comprehensive view of capital efficiency, ROCE is among the most valuable ratios used in IPO investing.
In addition, there are some ratios which can be helpful in specific cases.
#6 Price to Book (PBV) Ratio
The Price to Book Ratio (PBV) is calculated by dividing the stock’s current price by its book value per share. In this case, book value might be defined as a company’s net asset value, which is computed as total assets minus intangible assets and liabilities.
Formula for PBV ratio:
Price to Book Ratio = (Price per Share)/(Book Value per Share)
The PBV ratio indicates how much shareholders pay for a company’s net assets. In general, a lower PBV ratio may indicate that the stock is undervalued.
However, once again, the definition of lower differs per industry. When examining the PBV ratio, an apple-to-apple comparison should be made. An IT company’s price to book value ratio should only be compared to the PBV of another IT company, not any other industry.
#7 Current Ratio
The current ratio is an important financial indicator for assessing a company’s liquidity. It calculates the proportion of current assets that can be used to cover current liabilities.
This ratio indicates the company’s ability to pay short-term liabilities with short-term assets. If the ratio is greater than one, the company has more short-term assets than short-term obligations. However, if the current ratio is less than 1.0, the inverse is true, and the corporation may be vulnerable.
The current ratio can be calculated as:
Current Ratio = (Current Assets)/(Current Liabilities)
This financial ratio indicates the company’s ability to pay short-term liabilities with short-term assets. If the ratio is greater than 1.0, the company has more short-term assets than short-term debts. However, if the current ratio is less than 1.0, the inverse is true, and the corporation may be vulnerable. As a general guideline, invest in a company with a current ratio higher than 1.
#8 PEG Ratio
The PEG Ratio (Price/Earnings to Growth Ratio) is a valuation metric that helps investors assess the relationship between a company’s price-to-earnings (P/E) ratio and its expected earnings growth rate. It is calculated using the formula:
PEG Ratio = P/E Ratio / Earnings Growth Rate
The PEG ratio aims to provide a more complete picture than the P/E ratio alone by incorporating the expected growth rate of earnings. This adjustment allows for better comparisons among companies with different growth rates, as high-growth companies often have higher P/E ratios. A PEG ratio of 1 is typically considered ideal, indicating that the stock is fairly valued relative to its growth prospects. Ratios above 1 suggest that the stock may be overvalued, while ratios below 1 indicate potential undervaluation.
Utility in Stock Selection
- Valuation Assessment: Investors use the PEG ratio to determine if a stock is overvalued or undervalued based on its growth potential. A lower PEG ratio can signal a buying opportunity, particularly in growth stocks.
- Comparative Analysis: The PEG ratio allows investors to compare companies across different sectors or industries by normalizing the P/E ratios against their growth rates. This is particularly useful in identifying attractive investment opportunities in high-growth sectors.
- Growth Expectations: By factoring in expected earnings growth, the PEG ratio helps investors focus on companies that not only have strong earnings but also have solid growth prospects, aligning with long-term investment strategies.
- Investment Decisions: Investors often consider the PEG ratio alongside other financial metrics to make informed decisions about stock purchases, ensuring a balanced approach that accounts for both current valuation and future growth potential.
the PEG ratio serves as a valuable tool for investors looking to evaluate stocks based on their earnings potential relative to their market price, facilitating more informed investment choices.
Conclusion
There is no dearth of ratios and financial figures that can be analyzed to gain a better understanding of a company’s financial performance. However, these five ratios in IPO investing can do the heavy lifting for you and help in building an initial impression that wouldn’t be very far from reality.


