The Indian stock market is experiencing a significant influx of traders and investors, with substantial trading volumes occurring daily, particularly in the Futures and Options (F&O) segment. Options trading has become increasingly popular among both retail and institutional traders due to its unique characteristics. This article explores the best indicators for intraday trading, focusing on those that enhance decision-making in options trading.
Understanding Options Trading: A Guide for Traders
Traders use technical indicators some of which are the best indicators for options trading. Options trading differs from equity trading mainly due to the short lifespan of options contracts. Approximately 90% of options expire worthless, necessitating a more strategic approach. Intraday traders often rely on technical indicators to make informed decisions about entering and exiting trades. Here are some of the best indicators for options trading:
- Relative Strength Index (RSI)
- Bollinger Bands
- Money Flow Index (MFI)
- Intraday Momentum Index (IMI)
- Supertrend
- Put Call Ratio (PCR)
- Open Interest (OI)
Read Also: Fyers Brokerage Calculator
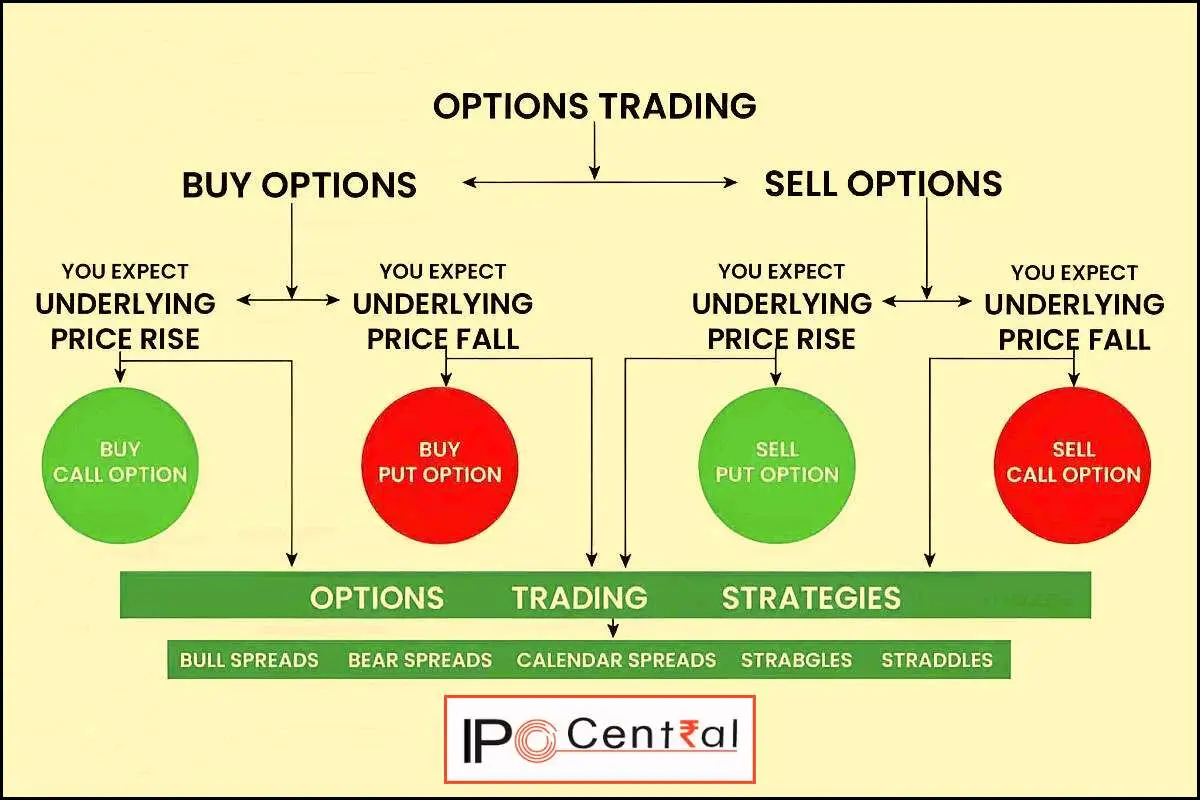
Before diving into options trading, it’s crucial to grasp the underlying processes and associated risks. When traders anticipate that a stock’s price will rise, they typically consider two main strategies:
Bullish Strategies
- Call Option: Traders can purchase a Call option at the nearest strike price. This strategy allows them to capitalize on the stock’s potential price increase.
- Put Option: Alternatively, traders can sell a Put option at the nearest strike price. This approach enables them to profit in a bullish market scenario.
Conversely, during a downtrend, traders can explore the following strategies:
Bearish Strategies
- Call Option: Traders may choose to sell a Call option at the nearest strike price, which allows them to benefit from an anticipated decline in the stock’s price.
- Put Option: Another option is to buy a Put option at the nearest strike price, providing an opportunity to profit from a bearish market outlook.
Understanding Strike Prices
The strike price refers to the closest price to the current stock value at which options are available. For example, if the Nifty index is at 23,523, the nearest strike prices would be 23,500 for Call options and 23,550 for Put options.
Managing Time Decay
To minimize the effects of time decay—where an option’s premium gradually decreases as expiration approaches—traders should close their trades within the same day. Time decay can significantly impact options trading, so utilizing technical indicators can aid traders in making informed decisions. Intraday technical indicators provide valuable signals that assist in entering and exiting trades effectively.
The Importance of a Rational Approach
Options trading carries substantial risks; without a well-thought-out strategy, traders can quickly lose their capital. Therefore, it’s essential to approach trading with a clear understanding of these dynamics and implement sound risk management practices. This version enhances readability while retaining the core concepts of options trading and risk management.
Read Also: Best Virtual Trading Websites in India
Best indicators for intraday trading
In the realm of intraday trading, a variety of indicators are available to help traders make informed decisions. For options trading specifically, it’s beneficial to focus on a select few technical indicators that are particularly effective. Traders can use these indicators either individually or in combination to enhance their trading strategies. Here are some of the best indicators for intraday trading:
Relative Strength Index (RSI)
The Relative Strength Index (RSI) is a widely used momentum indicator in trading that helps identify overbought and oversold conditions in a stock. By comparing the magnitude of recent gains to recent losses, the RSI calculates price momentum, making it a valuable tool for spotting potential trading opportunities.
The RSI scale ranges from 0 to 100, where a reading above 70 indicates the stock is overbought, and a reading below 30 indicates the stock is oversold. Traders utilize these readings, along with price divergences, to make informed decisions when entering options trades.
Application in Options Trading
While the RSI is particularly effective for trading individual stocks, it is generally not recommended for trading indices. For optimal results in options trading, it’s best to focus on high-beta stocks that offer sufficient liquidity. These characteristics enhance the RSI’s ability to identify favorable trading opportunities.

Read Also: Best option trading strategies for beginners
Bollinger Bands
Bollinger Bands are a widely recognized technical indicator among options traders, primarily used to assess market volatility, which is a critical factor influencing options prices. When market volatility rises, the distance between the Bollinger Bands increases, signaling potential price movements. Conversely, during periods of low volatility and minimal price changes, the bands contract.
The upper band serves as a resistance level, while the lower band acts as a support level. As the stock price approaches either band, there is a heightened chance of price reversals. If the price breaks through these levels, it often indicates a significant shift in market dynamics, allowing for gradual price adjustments.

Using Bollinger Bands: Best Indicators for Day Trading
For day trading, Bollinger Bands are regarded as one of the best indicators for identifying potential trading opportunities. When the price breaches the upper band, traders may consider buying a Put option or shorting a Call option. Conversely, if the price falls below the lower band, traders might look to buy a Call option or short a Put option.
By utilizing Bollinger Bands, options traders can effectively assess market volatility, pinpoint critical support and resistance levels, and make informed decisions to take advantage of potential price movements. This indicator helps traders navigate the complexities of the market and enhance their trading strategies.
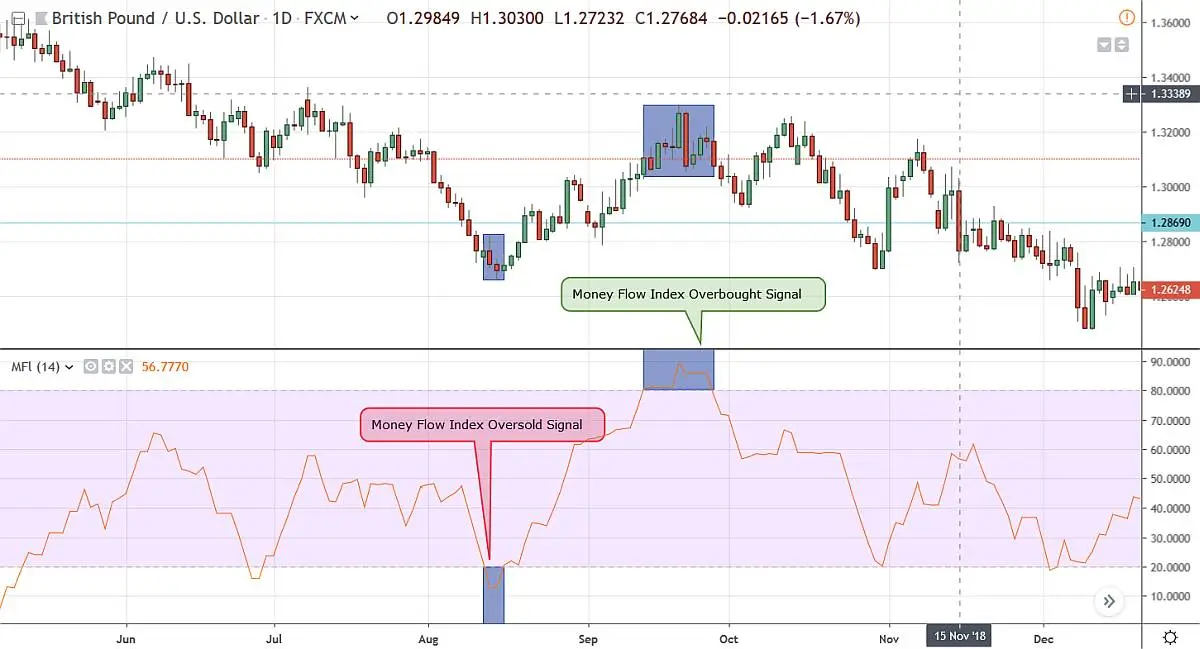
Money Flow Index (MFI) – Among the best intraday trading indicators
The Intraday Momentum Index (IMI) is widely recognized as one of the premier option trading indicators, particularly favored by high-frequency traders engaged in intraday activities. This powerful tool merges the principles of oversold and overbought conditions with the dynamics of the intraday trading range.
For those involved in intraday trading, the IMI delivers valuable signals that help identify when prices deviate from their typical trading range, offering insights into potential reversal points. Additionally, it empowers traders to execute contrarian strategies during minor price fluctuations.
By incorporating the IMI into their trading approach, options traders can refine their intraday strategies and make more informed decisions based on the signals provided by this indicator. This can lead to more successful trading outcomes and enhanced performance in high-frequency options trading during intraday sessions.
Supertrend: A Powerful Tool for Options Trading
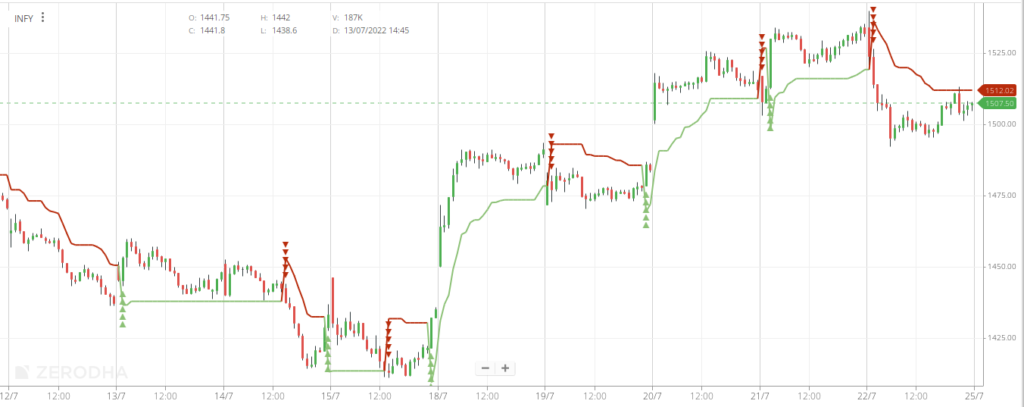
Supertrend is widely regarded as one of the most effective indicators for options trading. While it shares similarities with moving averages and the MACD, its foundation lies in the Average True Range (ATR). The indicator comprises two main components, typically using a default ATR of 10 periods and a multiplier of 3.
Effectiveness in Intraday Trading
For intraday traders, Supertrend proves particularly valuable on a 15-minute chart. Options traders appreciate its ability to deliver clear buy and sell signals, enhancing its reputation as a top choice in this field.
Using Supertrend with Other Indicators
To maximize its potential, traders often combine Supertrend with other indicators. A buy signal is triggered when the Supertrend indicator falls below the price candle, while a sell signal occurs when it rises above the price candle.
By integrating Supertrend into their trading strategies, options traders can make more informed decisions and improve their trading performance. Its capacity to provide definitive buy and sell signals is a significant asset in the dynamic world of options trading.
Put Call Ratio (PCR)
The Put Call Ratio (PCR) serves as a valuable market sentiment indicator by comparing the total volume of Put options traded to the total volume of Call options traded. Instead of focusing solely on the absolute PCR value, analyzing its fluctuations can offer clearer insights into changes in market sentiment.
How PCR is Calculated
The formula for calculating the PCR is straightforward:
PCR = Total volume of Puts traded / Total volume of Calls traded.
- A PCR value greater than 1 typically signals a bullish sentiment in the market.
- Conversely, a PCR value below 1 indicates a bearish sentiment.
Traders often look at historical PCR values to pinpoint extreme levels of market sentiment, whether optimistic or pessimistic.
Utilizing PCR for Trading Strategies
By leveraging the PCR as a market sentiment gauge, traders can better understand the prevailing attitudes among investors. This insight can inform their options trading strategies, helping them identify potential trading opportunities and manage risks effectively. Keeping an eye on shifts in the PCR can be instrumental in navigating the complexities of the market.
Open Interest (OI)
Open Interest (OI) is a crucial metric in options trading. It represents the total number of outstanding contracts for a specific option at any moment. OI offers important insights into the strength of market trends. An increase in OI signals a strengthening trend, while a decrease indicates potential weakness.
| Price | Open Interest | Interpretation |
| Rising | Rising | Market/Security is Strong |
| Rising | Falling | Market/Security is Weakening |
| Falling | Rising | Market/Security is Weak |
| Falling | Falling | Market/Security is Strengthening |
In the dynamic Futures and Options (F&O) segment, OI values can fluctuate quickly, reflecting the current market sentiment and hinting at future price movements. Traders frequently combine OI with other indicators to refine their options trading strategies and better understand market trends.
Bottom Line
Trading options is tricky, risky, and requires the ability to react quickly. It is best to use a trading system using a combination of indicators to get confirmation about the trend before initiating a position. In the realm of intraday options trading, purchasing options tends to yield better results; however, it’s crucial to close or halt all trades before the market closes each day. Buying options is primarily suited for intraday strategies, while option writers typically hold their positions until expiration to benefit from premium decay caused by theta.
Although the indicators mentioned are commonly regarded as effective for intraday trading, many traders also choose to customize and create their own unique set of indicators that align with their specific trading approaches.
Latest Content From IPO Central
- How Many IPOs Have Withdrawn In India?
- Motilal Oswal Home Finance Q2 FY25 Performance
- The Exciting Upcoming IPOs in December 2024 You Can’t Miss!
- Eleven IPOs Next Week – Market Set to Witness Over INR 18,000 Cr Fundraising Action
- Vishal Mega Mart IPO Analysis
- Sai Life Sciences IPO Analysis
- Emerald Tyre IPO Allotment Today: What to Expect After 530.67X Subscription Surge
- Ullu Digital IPO – INR 135-150 Cr SME IPO to Launch by March 2025
- RBI’s NOD for Canara Robeco AMC IPO and Canara HSBC Life Insurance IPO
- Zepto Surpasses INR 1,000 Crore in Annualized Ad Revenue
- Dhanlaxmi Bank Rights Issue Dates, Price, Allotment, Entitlement


